When the model is solved, the results are separated into
material specific design results and generic results. The generic
Note that the
To Adjust the Number of Sections
Note
Internally, the program subdivides the
To Adjust the Number of Internal Sections
All other results are reported at the
Number of Sections that you specify in the Model Settings Dialog.
This controls how many places you receive reported or printed
Note
Access the Member Section Forces
Spreadsheet by![]() Forces.
Forces.
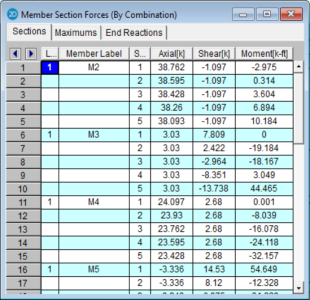
These are the
The units for the forces are shown
at the top of each column. As for the sign convention,
the signs of these results correspond to the
These are
This diagram shows a member section location with all positive section forces. As can be seen, the section forces listed at any given section are the left side forces. For axial forces, compression is positive. For moments, counter-clockwise around the member axis is positive.
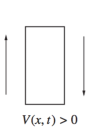
The sign convention for shear is positive when the free body diagram causes the member to spin clockwise (with I End on the left and J End on the right).
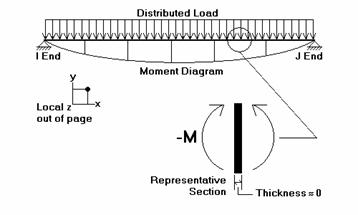
These section forces may also be displayed graphically. Remember that the section forces used for the plot are the left side forces. For an example of what you would see for the graphic plot of the moment diagram for a member, please see below:
RISA-2D
uses the right hand rule joint convention and is always consistent
with this convention. Since the left side moment is being used,
a
The 2nd/1st Moment Ratios Tab shows the ratio of maximum moment with and without secondary P-Delta effect. In general, the larger the ratio is, the more significant the secondary effect is. Notice that some design codes may have a limit on this ratio (e.g., ACI has this limit as 1.4), but this limit is not checked by the program.
For enveloped results, the maximum and minimum value at each location is listed. The load combination producing the maximum or minimum is also listed, in the "LC" column.
The moving load results are enveloped and will display the Load Combinations with maximum and minimum values shown for each section location, for each active member. The governing load combination and step location is shown for each result value under the "LC" column. The first number is the load combination, the second is the step number: (load combination - step number). See Moving Loads to learn more.
Note
Access the Member Stresses
Spreadsheet by ![]() Stresses
Stresses
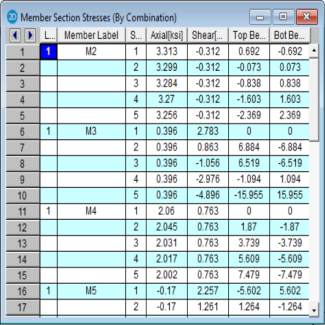
These are the member stresses calculated along each active member. The number of sections for which stresses are reported is controlled by the Number Of Sections specified in the Model Settings Dialog.
There will be four stress values listed for each section location along the member taking into account any member offsets. The units for the stresses are shown at the top of each column. As for the sign convention, the signs of these results correspond to the signs of the forces. These line up as positive or negative according to the member local axis directions. Compression is positive and tension is negative.
The axial stress is the ratio P/A, where P is the section axial force. A positive stress is compressive, since the sign of the stress follows the sign of the force.
The shear stress is calculated as V/As, where As is the effective shear area. The program obtains As by multiplying the total area by the shear stress factor. This factor is calculated automatically for most cross sections, but must be entered for Arbitrary members. Refer to Member Shear Stresses.
The bending stresses are calculated using the familiar equation M * c / I, where "M" is the bending moment, "c" is the distance from the neutral axis to the extreme fiber, and "I" is the moment of inertia. RISA-2D calculates and lists the stress for the section's extreme edge with respect to the positive and negative directions of the local z axis. A positive stress is compressive and a negative stress is tensile.
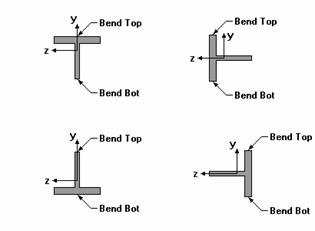
Note that two stress values are listed for each bending axis. This is because the stress values for a bending axis will not be the same if the shape isn't symmetric for bending about the axis, as with Tee and Channel shapes.
The locations for the calculated stresses are illustrated in this diagram:
For enveloped results, the maximum and minimum value at each location is listed. The load combination producing the maximum or minimum is also listed, in the "LC" column.
The moving load results are enveloped and will display the Load Combinations with maximum and minimum values shown for each section location, for each active member. The governing load combination and step location is shown for each result value under the "LC" column. The first number is the load combination, the second is the step number: (load combination - step number). See Moving Loads to learn more.
Note
Depending on whether a single angle has been fully restrained against rotation or not, it will either behave about its geometric axes or its principal axes. This behavior can be controlled by correctly specifying the unbraced lengths for the angle. In the diagram below the z and y axes are the geometric axes. The z' and y' are the principal axes. The y' axis is considered to be the weak axis for principal behavior, and the z' is considered to be the strong axis.
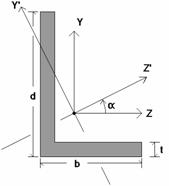
The orientation of the shape is defined using the local y and z axes shown in the above diagram, but for principal axis behavior the bending calculations are done with respect to the y' and z' axes shown (the principal axes). The y' axis is the axis of minimum 'I' and the z' axis is the axis of maximum 'I'. RISA calculates the angle "α" and transposes the moments as shown below:
Mz' = Mz * cos(α) + My * sin(α)
My' = -Mz * sin(α) + My * cos(α)
If the Rotate is set to "0" or "180" the Mz’ moment is shown as M on the section forces report. Likewise the bend-top and the bend-bot stresses are relative to the extreme fibers along the y’ axis. If the Rotate code is set to "90" or "270" the My’ moment is the moment shown as M on the section forces report. The bend-top and the bend-bot stresses are relative to the extreme fibers along the z’ axis.
Note
Access the Member Section Deflections
Spreadsheet by ![]() Deflections.
Deflections.
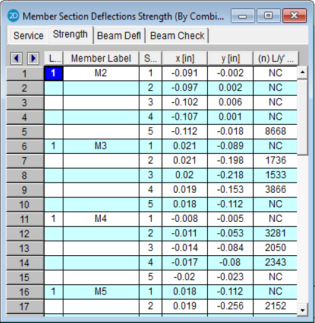
The Service and Strength tabs are the member deflections calculated along each active member. The number of sections for which deflections are reported is controlled by the Number Of Sections specified on the Model Settings Dialog.
The member section deflections are comprised of translations in the member local axis directions and the relative deflection to length ratio. The units for the deflections are shown at the top of each column. As for the sign convention, the signs of these results correspond to the member's local axes, using the right hand rule.
The L/y' ratio is
the total member length (minus member
offsets) divided by the relative deflection. The deflection in this calculation is not the deflection
shown in the column to the left, which
Expressed as an equation, n = L/deflection, where n is what is tabulated in the spreadsheet. The smaller the deflection, the larger the value. If 'NC' is listed, that means the 'n' value is greater than 10000 which is a very small deflection. The minimum value that will be shown is '1'. For example, if the deflection criteria is L/360, check here to make sure no tabulated values are less than 360. Greater than 360 is OK.
For enveloped results the maximum and minimum value at each location is listed. The load combination producing the maximum or minimum is also listed, in the "LC" column.
The moving load results are enveloped and will display the Load Combinations with maximum and minimum values shown for each section location, for each active member. The governing load combination and step location is shown for each result value under the "LC" column. The first number is the load combination, the second is the step number: (load combination - step number). See Moving Loads to learn more.
Note
The Beam Defl spreadsheet shows the strong-axis (y) relative deflections, y', for Beam member types. This spreadsheet will base the L'/y' Ratio on the actual span for multi-span beams. If there are multiple span beams, each span will have it's own entry. The L'/y' Ratio uses the span length of the beam, denoted by L' (as opposed to the full member length, L) compared to the relative deflection, y'.
The program will detect the presence of cantilever spans. If an entire member or the end span(s) of a member are unsupported at one end, the program will consider those spans a cantilever and use 2*Span Length for the L'/y' Ratio calculations.
The location and value for the relative deflection, y', is dependent on the beam being either supported or cantilever. For a member supported on both ends, the maximum relative displacement used in the beam deflection ratio will be the largest straight line distance (in the vertical y direction) between the deflected shape and the original undeflected shape.
For members with a cantilever end, the location of maximum relative displacement used in the beam deflection ratio will be at the free end of the member and is determined as the difference between the deflected shape and an undeflected projection based on the rotation and position at the support. Note that for cantilever members, L is taken as twice the length of the cantilever when reporting deflection ratio (in accordance with IBC 2018 table 1604.3 footnote i).
For multi-span members, the program will give span information in the expanded interactive strong-axis absolute deflection diagram. A vertical red line will be displayed at support locations which will give the proper span information.
The L'/y' Ratio is based on relative deflection and member span length. The relative deflection for each span takes into account the span end deflections and is the maximum vertical deflection component measured from the absolute displacement to a straight line drawn from one end of the span to the other. In the image below, the relative deflection, y', per span is called out as D1, D2, and D3.
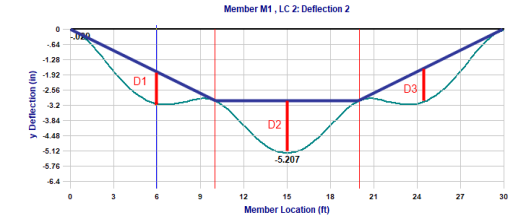
The green line is the actual deflected shape.
The light blue vertical line is the cursor marker in the expanded interactive strong-axis absolute deflection diagram.
The light red vertical lines are the support locations.
The dark blue lines are straight line connectors between supports at the deflected location.
The dark red vertical lines are the relative strong-axis (y) deflection used in the L'/y' Ratio.
While the program determines if a member is a cantilever or supported based on member behavior and modeling configuration, there may be cases where the beam is actually considered otherwise. In this case, the Deflection Ratio Options can be used to designate a member end specifically as supported or cantilever. Any members with designated support ends using the Deflection Ratio Options will be denoted by a star suffix on the L'/y' Ratio listed in the Beam Defl spreadsheet.
Note:
The Beam Check spreadsheet shows the local strong-axis (y) deflections for Beam member types for load combinations defined in the Member Design Rules - Deflection tab. If a deflection value exceeds the limit from the design rule then the value will show in RED. This spreadsheet will also base the L/y ratios on the actual span for multi-span beams. If there are multiple span beams each span will have it's own entry.
Note: